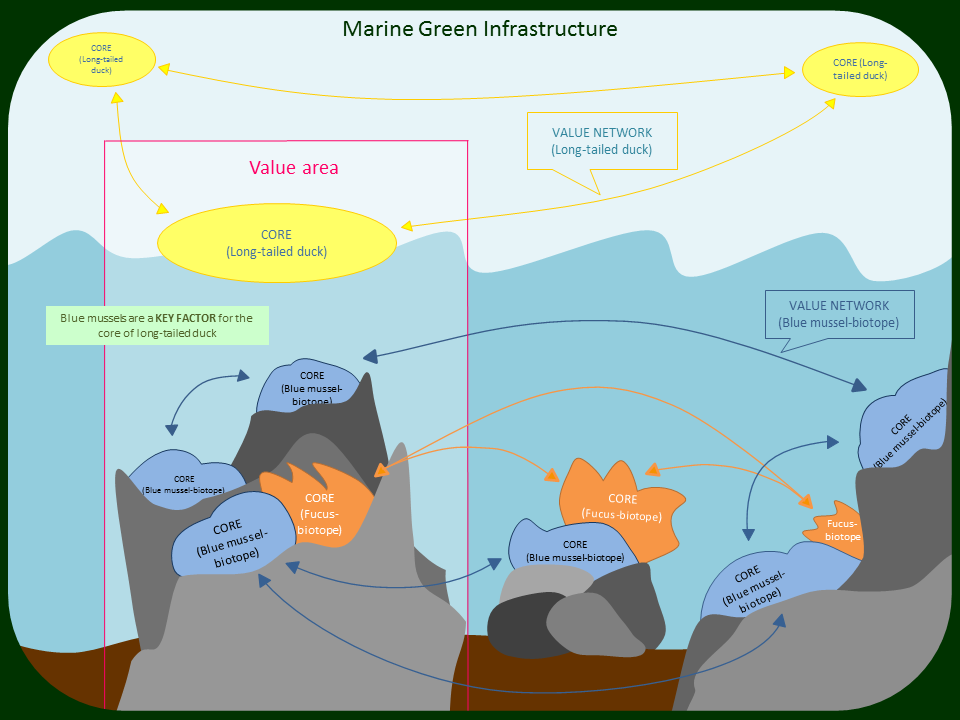
Figure 1. A schematic figure of central components of the suggested framework of Marine Green Infrastructure. A “Core” (värdekärna) is a location of an ecosystem component (species, species complex or habitat) with a high conservation value, based on criteria relating to biodiversity, threat and ecosystem services. A “Value Area” (värdetrakt) is an area with many Cores. A “Value Network” is a new term, referring to a network of cores with functional connectivity. Key factors refers to structures, functions and processes that enable a functioning green infrastructure, i.e. requirements on habitats and spreading (Hogfors 2015).
The report ”Marin grön infrastruktur – naturvärdesbedömning, nyckelfaktorer och påverkansfaktorer” (~Marine Green Infrastructure – conservation value assessment, key factors and human impacts; Hogfors 2015) suggest a framework regarding the work with green infrastructure in Swedish marine waters. Adapted to the marine environment, the report suggest definitions of central concepts within marine green infrastructure (MGI; Figure 1). Moreover describes the report how to identify these areas of ecological importance as well as their key factors (i.e. structures, functions and processes) enabling a functional green infrastructure.
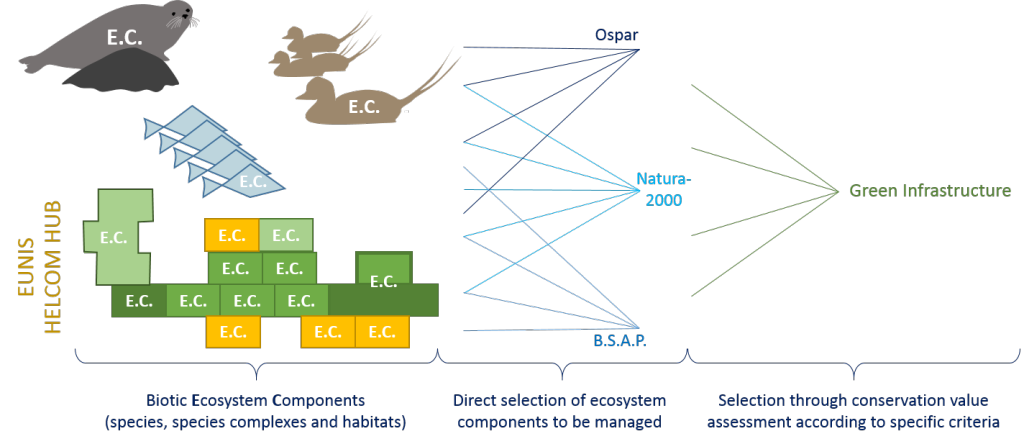
Central to the proposed framework is the conservation value assessment of biotic ecosystem components (Figure 2), which is proposed to be done in two steps – one on a regional level and one at a local level. This approach provides synergies and harmonization between areas without losing local aspects.
The report ”Kartunderlag för marin grön infrastruktur – behovsanalys, datasammanställning och bristanalys” (~Map data for MGI – analysis of requirements, data compilation and gap analysis; Enhus & Hogfors 2015) analyze the needs of area coverage map data as a basis for MGI and other marine planning and management. To our knowledge, all existing area coverage maps describing the distribution of different habitats and habitat complexes have subsequently been compiled, as well as a variety of species. Each map has been evaluated if they fulfil the requirements of different management needs (such as MGI) and the evaluations are presented in tabular format on county basis. A gap analysis was carried out concerning the map’s relevance, quality and spatial coverage of the county.
Furthermore, is an overall national picture of MGI presented in two maps over Swedish marine areas based on existing national data. One map shows conservation values that have been mapped and another map shows both mapped and presumed conservation values (Wijkmark 2015).
The projects were commissioned by the Swedish Agency for Marine and Water Management (SwAM) and are included in the work linked to the government commission concerning green infrastructure.[1]
Figure 2. Different selection methods pertaining to which biotic ecosystem components should be managed according to various directives/policy documents. The selection of ecosystem components can be made either directly (e.g. Ospar, Natura 2000 and B.S.A.P.) or by following a number of criteria in a conservation value assessment (e.g. marine green infrastructure). The latter approach has the advantage of offering higher flexibility to local aspects (Enhus and Hogfors 2015).
[1] Regeringen 2014. Uppdrag att ta fram riktlinjer och en genomförandeplan avseende regionala handlingsplaner för grön infrastruktur. M2014/1948/Nm
